
Review written by Yinuo Zhang (ECON)
The tradeoff between social distancing and its potential adverse economic effects has been at the center of debates during COVID-19 in the United States. On one hand, it is crucial to practice social distancing to prevent further spread of COVID-19. On the other hand, economic activities plummeted due to the closing of non-essential businesses mandated by many states. As a result, initial unemployment claims reached an unprecedented number of over 6.8 million on March 28th, the highest since 1967. The rapid development of COVID-19 has called urgent attention to the impact of existing public health interventions and its consequences on the real economy. In particular, do non-pharmaceutical interventions (NPI) like social distancing further hinder economic activity on top of the ongoing pandemic? Does the tradeoff between social distancing and subdued economic activities exist?
Recent work by Emil Verner, former Princeton PhD student and now assistant professor at MIT Sloan School of Management, along with Sergio Correia of the Federal Reserve Board and former Princeton lecturer Stephan Luck (now at the Federal Reserve Bank of New York), examines the impact of NPIs on the economy in the context of the 1918 Flu. On the whole, their findings suggest that despite the short-run economic disruptions associated with the pandemic, economic patterns were largely similar across cities with strict and relaxed NPIs. Moreover, cities with stricter NPIs were associated with better economic outcomes, measured in manufacturing employment, output, and the size of the local banking sector. Given that cities with stricter NPIs were more effective at “flattening the curve”, their findings suggest that NPIs can reduce the spread of the pandemic without necessarily further dampening the economy.
The 1918 Flu Pandemic spread worldwide from January 1918 to December 1920. In the U.S, the death toll was about 550,000 to 675,000, which accounted for about 0.66% of the population during this time. Deaths usually occurred about 10 days after contracting the virus. The influenza came in three different waves: first in spring 1918, second in fall 1918, and third in the winter of 1918-1919 and spring of 1919. It peaked in the U.S. during the second wave in the fall of 1918.
The NPIs applied during the second wave largely resembled the ones currently taking place in order to control COVID-19 in the U.S. Initiatives in 1918 included social distancing measures such as the closure of schools, theaters, and the banning of mass gatherings, mandated mask wearing, case isolation, making influenza a notifiable disease, and public disinfection/hygiene measures. However, the closure of non-essential businesses was not included as part of the NPIs in 1918. Instead, business hours were reduced to prevent crowds on public transportation.
The main data used in Verner and colleagues’ study includes information on city-level NPIs, influenza mortality, economic activity and bank balance sheets. The measures of city-level NPIs rely on historical data from municipal health department bulletins, local newspapers, and reports on the pandemic. The key city-level variations are the NPI speed and NPI intensity. NPI speed is measured as the difference between the date when the city first enforced a local NPI and the mortality acceleration date when the mortality rate exceeded twice its baseline death rate. NPI intensity is defined to be the cumulative sum of the number of days where three types of NPIs (school closures, public gathering bans, and quarantine of suspected cases) were activated in Fall 1918. The influenza mortality data was collected from the Center for Disease Control’s (CDC) Mortality Statistics tables.
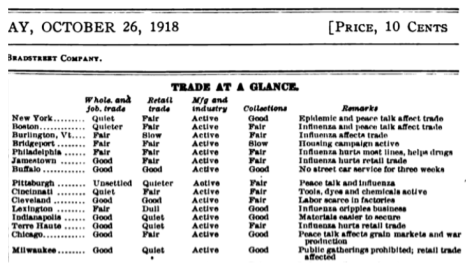
The measures of short-term economic activity disruptions were taken from the “Trade at a Glance” tables from a weekly trade journal called BradStreet’s. These tables summarized the conditions of wholesale trade, retail trade and manufacturing in descriptive words like “reduced”, “quieter”, “shifting”, “increasing”, etc. The descriptions were then categorized to “not disrupted” or “disrupted” and aggregated to the monthly frequency.
Medium-run economic outcome measures included city-level manufacturing employment and output from the Census of manufactures, as well as city-level annual bank assets. Other observables that may reflect the fundamental economic differences across regions, such as city population, public health spending per capita, etc, were used as control variables in subsequent regressions.
A main challenge to their study is the endogeneity of policy response: a higher historical exposure to flu could be a latent variable that affected both city-level NPI responses and mortality rates. A more thorough institution of policies could be another latent variable that affected both NPI responses and correlated to better economic prospects. Both aspects are likely to result in biased estimates. To address the first concern, the authors first control for lagged city-level influenza and pneumonia mortality in the previous year. The identification assumption here is that the spread of 1918 flu did not alter the underlying mortality rate of influenza and pneumonia caused by other viruses or bacteria so that the lagged mortality rates were a good predictor of those in 1918. To address the second concern, the authors argue that a city’s distance from the East Coast explains a large part of the variation in NPIs, as the pandemic swept the country from east to west.
The first estimation conducted is to examine the effect of NPIs on mortality. The authors propose a linear regression model where the dependent variable is mortality rate from influenza and pneumonia, the key variables being the NPIs intensity and speed, with controls on city-level characteristics. The estimation suggests that cities with more aggressive NPI intensity, as well as more rapid implementation, were statistically more effective at reducing the mortality rate. Specifically, cities with more aggressive and rapid NPI enforcement experienced a 45% reduction in peak mortality relative to the mean.
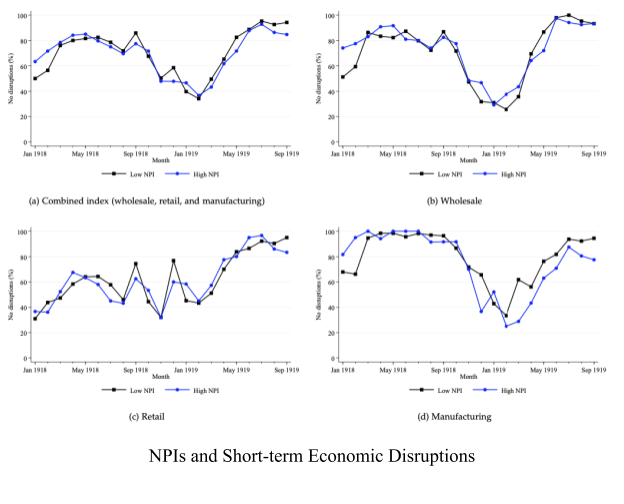
The next estimation conducted is to examine whether NPIs that flattened the curve were associated with a worse economic downturn in fall 1918 in the short term. In the figure below, the authors plot the monthly average of no-disruption indices for specific economic sectors with respect to cities of low and high NPI levels from January 1918 to September 1919. The first panel depicts the indices for Wholesale Trade, Retail Trade, and Manufacturing combined. The remaining panels plot the individual sectors’ no-disruption indices. A first observation is that the pandemic itself was associated with disruptions in economic activities that lasted from Fall 1918 to Spring 1919. The second observation is that the decline was similar in both high and low NPI cities. To show statistical support, the authors propose a difference-in-difference framework to estimate the impact of NPI. One can consider low NPI cities as control groups, high NPI cities as treatment groups, and NPIs of different intensities as a quasi-experiment. If both control groups and treatment groups experience a similar trajectory of economic disruptions before the intervention, one could identify the impact of intervention by comparing the changes in economic disruptions over time between the control groups and the treatment groups. The results suggest that higher NPIs are generally not associated with any statistically significant reductions in economics disruptions.
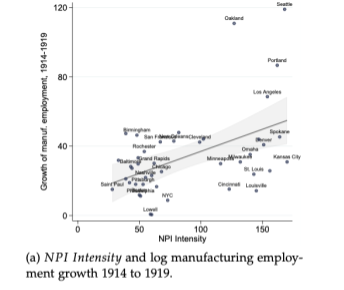
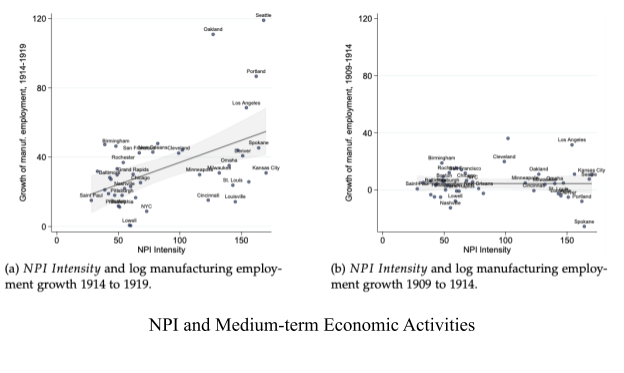
Next, the authors proceed to ask whether NPIs have additional adverse impacts on economic activity in the medium run. The scatter plot below suggests that cities with a higher intensity of NPIs were positively correlated with the growth of manufacturing employment. Though some might suggest that these cities were on different employment growth trajectories prior to the 1918 flu, the panel to the right rules out this possibility. A subsequent formal dynamic difference-in-difference framework suggests that cities with stricter and more rapid NPIs enforcements saw around 11% higher manufacturing employment and 18% higher output post pandemic, after controlling for observed differences across cities. Even those more conservative estimates reject the hypothesis that cities with stricter NPIs experienced a larger decline in economic activities compared to their more lenient counterparts in the years following the pandemic.
When translating their conclusion on the 1918 flu to the current COVID-19 context, the authors point out several caveats. First, the sample size is limited to only 43 cities and the analysis of pre-trend economic activities is limited due to data constraints. Second, NPIs in 1918 were less extensive than those being enforced today. For example, the closing of non-essential businesses was not part of the NPIs adopted back in 1918. Third, the economy’s structure in 1918 was very different from nowadays. For example, the end of WWI provided an unique economic environment with massive fiscal spending on the manufacturing sector.
Nevertheless, the authors provide some possible mechanisms to explain why NPIs might not further suppress the economy. One possibility is that households were likely to reduce the frequency of getting groceries and retail shopping even in absence of NPIs in order to avoid contracting the virus. Further, businesses would tend to reduce investment in response to labor shortages, lower demand, and increased uncertainty. The vast data we have available today enables economists to test these mechanisms in the context of COVID-19. The authors look forward to seeing future works dedicated to disentangling the direct costs and indirect benefits of NPIs implemented during COVID-19. Nevertheless, this is one of the first research works that study the impact of public health interventions on the real economy.
Verner, Correia, and Luck are continuing the research described here by investigating “how the non-pharmaceutical interventions implemented in 1918 affected local health and economy activity using other historical data sources.”
The original article was published in SSRN on March 26, 2020. Please follow this link to view the full version.